


What do you know about Venn diagrams? We use Venn diagrams to represent logical relationships between elements in a group visually. In a nutshell, it is a tool we use everywhere — from schools, media, business, etc. — thanks to its flexibility.
That said, it’s crucial to know the system of notation used in making Venn diagrams. Before you jump right into making a Venn diagram, you first need to become familiar with its symbols and functions. This article will guide you through all the things you need to know about this diagram. We’ll also be adding some free templates you can use to jumpstart your process!
What is a Venn Diagram?
So, what exactly is a Venn diagram? It’s a schematic representation of elements in a group, showing all their possible logical relationships. A Venn diagram utilizes overlapping circles to represent formed sets and highlight the shared similarities and differences between each category.
It’s also known as a set or logic diagram, as its most common use is in a branch of logic called the set theory. It is a foundational mathematical system that helped develop our contemporary understanding between real numbers and infinity.
With this, Venn diagrams offer a powerful way of displaying data in many fields. It’s a common tool used in business, statistics, logic and computer science.
Venn Diagram Examples
What’s great about using Venn diagrams is that you can have some fun with them! Since it’s flexible, you don’t have to stick with a particular illustration in presenting your data; it would all come down to the type of information you want to relay. But in general, here are the common types of Venn diagrams:
- two-set
- three-set
- four-set
- five-set
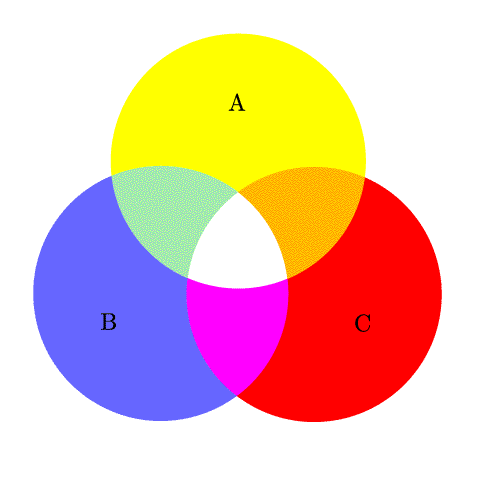
And here’s an interesting bit for you: Venn diagrams are not limited to circles. You also have more options than a black Venn diagram. Yes, you read that right. You don’t have to repeatedly use a 2 circle or a 3 circle Venn diagram. You can use ovals, rectangles, triangles and basically any closed curve too! You can also play around with the colors to make it more engaging.
To give you some ideas, take a look at some examples below.


Venn Diagram Symbols
Venn diagram symbols borrow from set theory. Thus, learning the Venn diagram symbols is also a way of tracing the Venn diagram math roots. Take a look below.
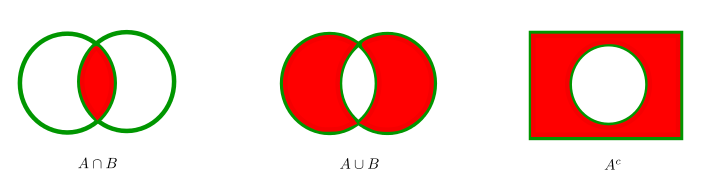
Union (∪)
Each set of shapes in a Venn diagram represents a category. Illustrated by the symbol ∪, this figure represents the union of two sets in a Venn diagram. It represents the category that belongs to either of the sets or both.
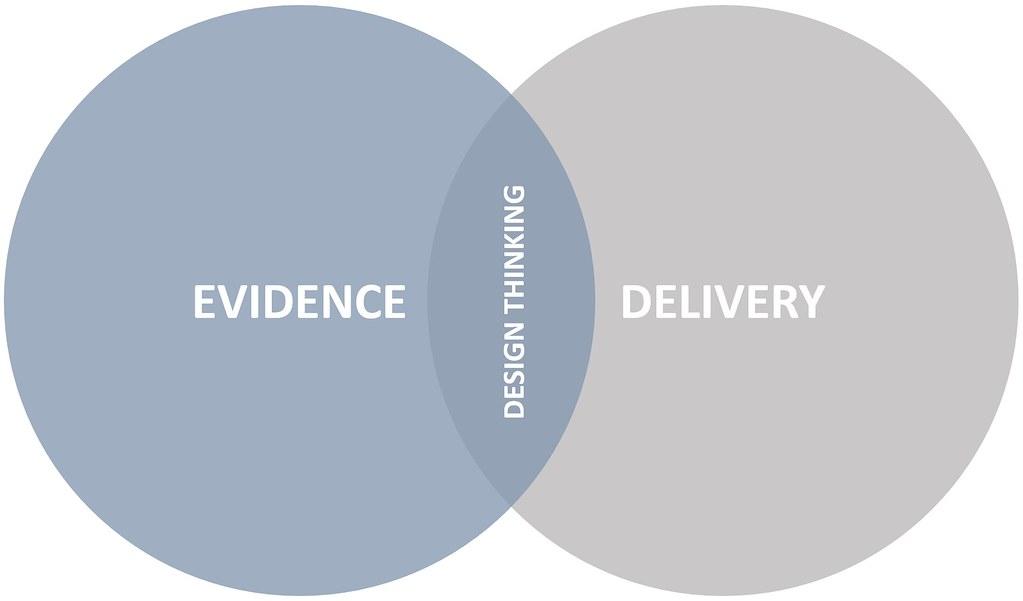
Take the two-set Venn diagram as an example; set A can represent people who can play drums while set B can illustrate people who play the guitar. Here, A ∪ B represents those who play drums, guitar, or both.
Intersection (∩)
A defining characteristic of a Venn diagram is the intersections between sets. Illustrated by the symbol ∩, intersection represents the area where sets intersect — their shared categories. That said, it demonstrates the category that belongs to both sets.
Let’s again use a two-set Venn diagram as an example. The category in the middle is where the two sets overlap. Continuing from the previous example, A ∩ B includes those who play both drums and guitars.
Complement (Xc)
Lastly — the complement. The categories that are not represented in a set is illustrated by the symbol Xc.
To further explain, we use the equation Xc = U/A or Xc = U/B. Here, the U represents the given universe. In the first equation, everything in the universe is the absolute complement of A in U, excluding A. The same goes for the latter, where everything in U is the absolute complement of B in U, excluding B.
In our example, Ac would be everyone who does not play drums. Meanwhile, Bc would be everyone who does not play the guitar.
Benefits of Making Venn Diagrams
Again, Venn diagrams are the go-to visual tool for many people for depicting data and information. But what exactly are its main selling points?
- Visually organizes information in a way that it becomes easier to see the logic behind the relationships of elements.
- Clearly shows data patterns that may not have been obvious in data form.
- Makes comparing and contrasting between data easier and helps in deducing correlations and probabilities.
- Helps in making the right decision between multiple choices.
- Helps provide more information and generate discussion.
Venn Diagram Your Way Through!
Now that you know everything about the basic Venn diagram symbols and the fundamentals of making it, the next step is to make one.
And if you’re looking for the best platform for creating Venn diagrams, use Venngage. In just a few clicks, you can create a professional-looking Venn diagrams—from a blank canvas or from hundreds of ready-to-use templates. The sky’s the limit to what you can do with this awesome editing platform!